Statistics
Load a CSV or Excel table, run basic statistics, regression, ANOVA, DOE, control charts and more, draw interactive charts, and export the results to Excel or PowerPoint. The statistics app runs at stats.frisbly.com and opens in a new tab with your Frisbly account.
Open Statistics(Opens in a new tab)
Opens stats.frisbly.com in a new tab. Sign in with the same Google account you use on Frisbly.
What the statistics app is
Statistics is a separate Frisbly service for people who have a table of numbers and want summaries and charts without installing a spreadsheet add-in or a statistics package. It lives on its own host, stats.frisbly.com, and uses the Frisbly sign-in. The server does not write the files you load to disk.
What you can do
- Data: load a CSV or Excel (.xlsx) file as a data sheet.
- Stat: Basic Statistics, Regression, ANOVA (General Linear Model), DOE (Factorial, Response Surface, Screening, Mixture, Taguchi), Control Charts, Quality Tools (Capability Analysis, Gage Study), Multivariate, Tables, Nonparametrics, Equivalence Tests, Power and Sample Size, Reliability/Survival, Time Series.
- Graph: interactive charts from the same columns.
- File: export the sheet or the results to Excel, or the charts to a PowerPoint file.
How to use it
- Press “Open Statistics”. The app opens in a new tab on stats.frisbly.com in the language you are reading now.
- Sign in with your Frisbly account when asked. The account is shared, so there is no second password.
- Load a CSV or Excel file into the data sheet.
- Pick an analysis from the Stat menu, read the result, and use the Graph menu when you want a picture.
- Export the result as Excel or PowerPoint. Close the tab when you are done; this Frisbly tab stays where it was.
Screens
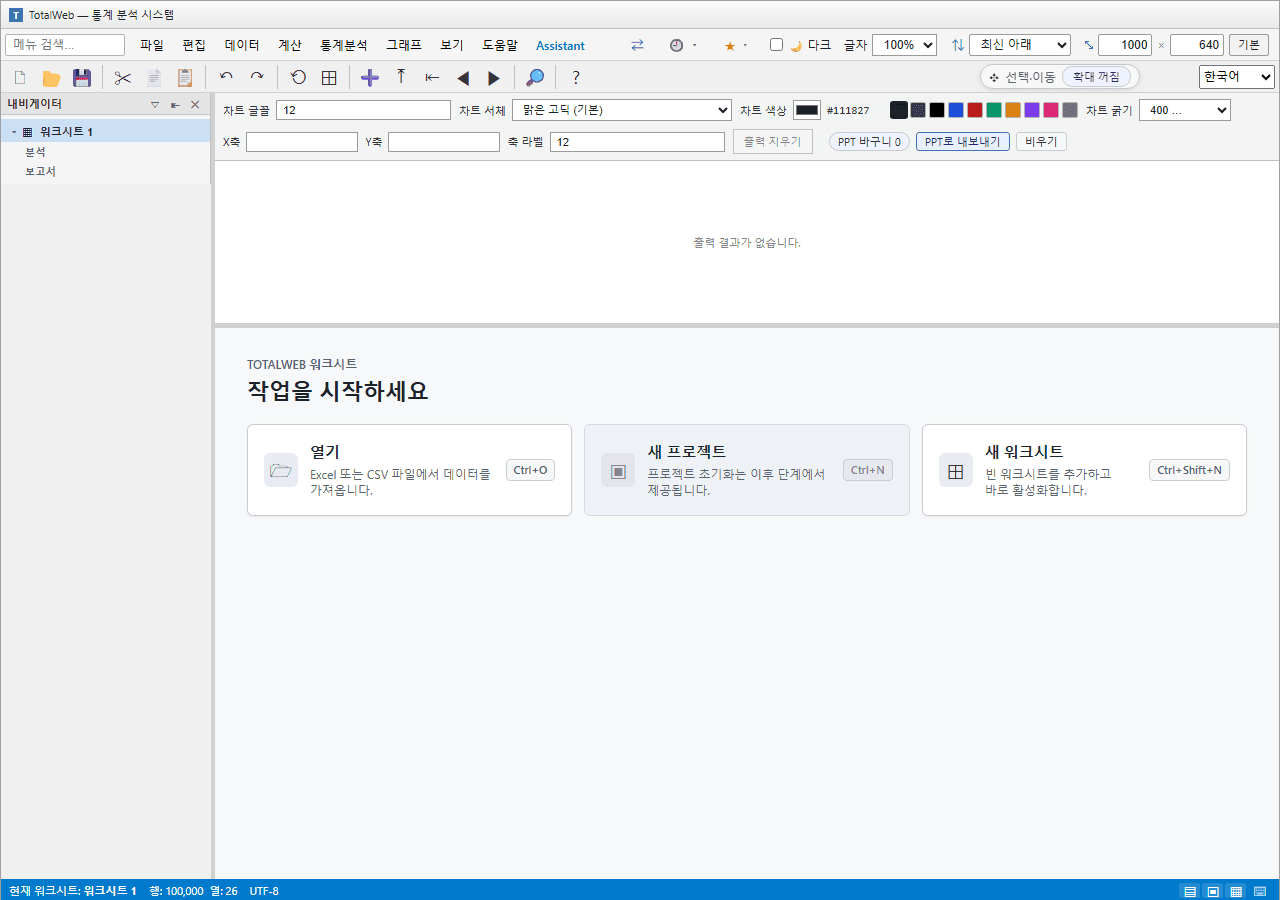
The workspace after sign-in. Load a CSV or Excel file from the File menu to begin. 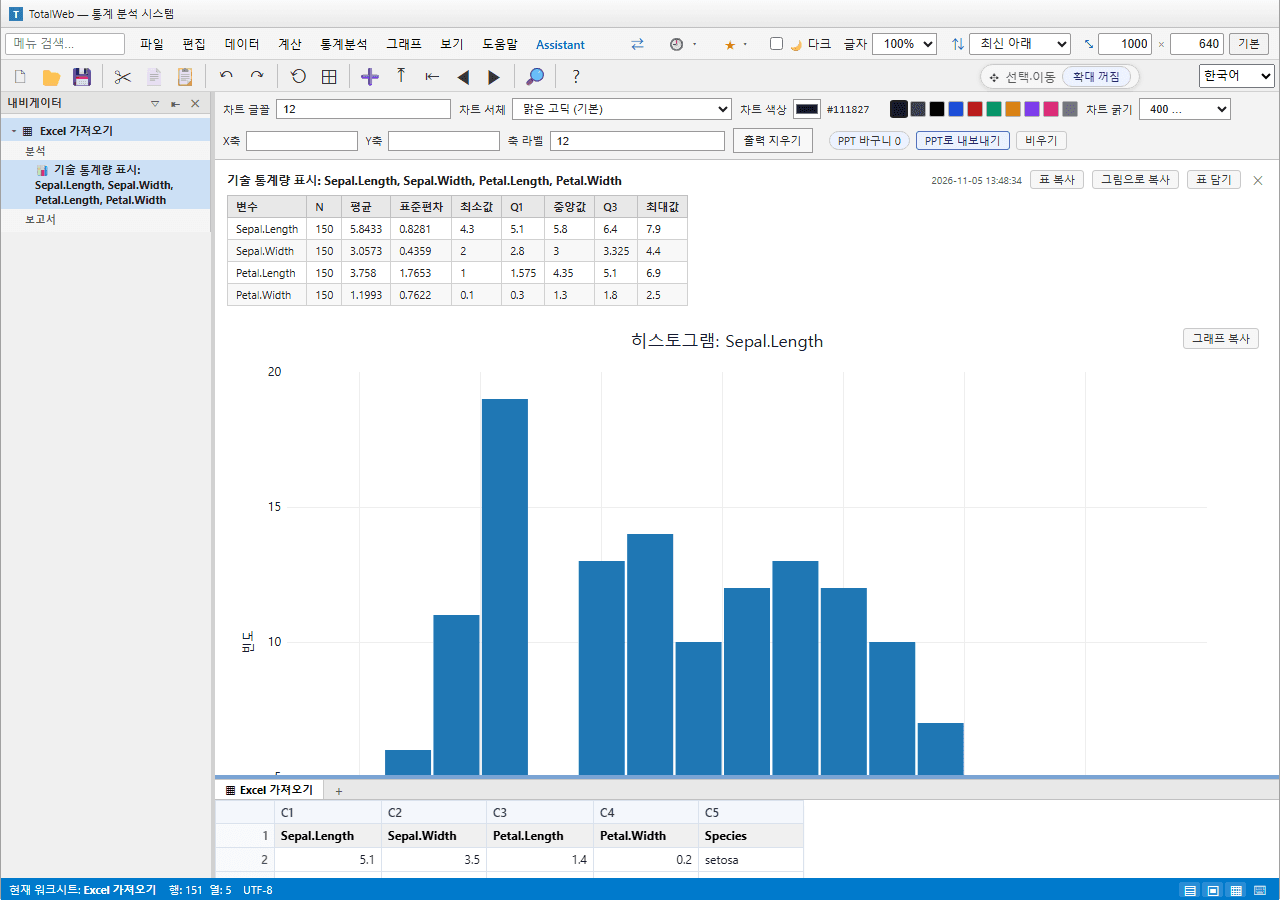
Basic Statistics › Display Descriptive Statistics on a 150-row sample (result pane widened). 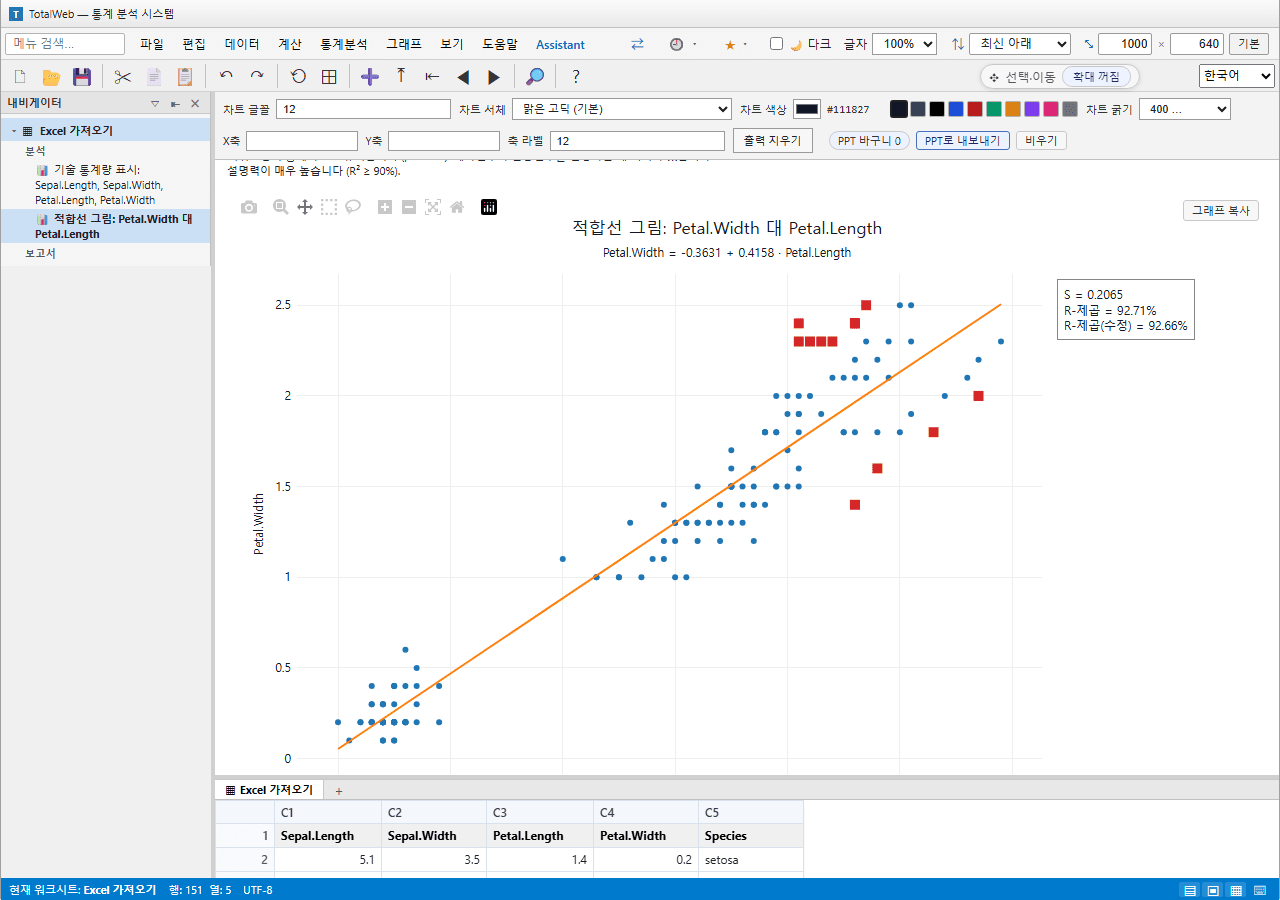
Regression › Fitted Line Plot on the same sample (result pane widened).
Frequently asked questions
- Is the data I load uploaded or stored?
- The file is sent to the statistics server for the calculation. The server does not write it to disk. This is different from the Frisbly converters on frisbly.com, which never send your file anywhere.
- Do I need another account?
- No. Statistics uses the same Frisbly sign-in: the new tab asks you to sign in with the same Google account, and there is no separate password.
- Why does it open in a new tab?
- The app runs on its own host, stats.frisbly.com, and keeps your working sheet in that tab. Opening it separately means a click on a Frisbly link cannot close a sheet you have not exported yet.
- Which files can I load?
- CSV and Excel (.xlsx). If your data is JSON, convert it to CSV first with the CSV JSON converter on Frisbly, then load the CSV.